Contents
 (Source: https://miro.medium.com/max/1400/1*F-1fq9TNjDnAYPAXnZP4Ww.png)
Online Machine Learning with Tensorflow.js
An end to end guide on how to create, train and test a Machine Learning model in your browser using Tensorflow.js.
Introduction
Thanks to recent advancements in Artificial Intelligence it is now becoming relatively easy to build and train Machine Learning models. Although, these models can only benefit society by sharing them and making them ready to make predictions online.
In one of my previous articles, I explained how to create and deploy a simple Machine Learning model using Heroku and Flask, today I will instead provide you another option: Tensorflow.js.
Tensorflow.js is a Javascript library created by Google to embed Machine Learning capabilities to any form of web application.
In order to add some in-browser visualizations, Tensorflow.js makes use of a small library called tfjs-vis. This library can then be used to create a side Visor on which all the content can be displayed.
In addition to this, Google also developed another library called ml5.js which is designed to make very easy to deploy pre-trained models online. In this way, also nonspecialist can get started deploying machine learning models on the Web. A simple example of how to use a Google PoseNet pre-trained model is available here.
There are 3 main types of model which can be deployed online:
- Regression Models
In this example (GIF 1) I decided to train and visualize a simple regression model using the “Swedish Committee on Analysis of Risk Premium in Motor Insurance” dataset. The training process takes place in real-time online once you open the webpage.
 GIF 1: Training and Visualizing online a Regression Model
- Classification Models
In this example (GIF 2) I instead decided to train a classification model using the “Wine Data Set”. Also in this case, the training process takes place in real-time online. Additionally, a summary of the used Neural Network layers characteristics and a Classification Matrix are provided.
 GIF 2: Training and Visualizing online a Classification Model
- Pre-trained Models
Lastly, in this example (GIF 3), I decided to use a Pre-Trained model. I first trained this model in Python using the “Pima Indians Diabetes Database”, saved it as a JSON file and finally deployed it online ready to make predictions.
 GIF 3: Making Predictions and Visualizing online using a Pre-Trained Model
All these 3 examples are available on my personal website, in case you are interested in testing them out.
In this article, I will walk you through how to realize the first of these three examples.
All the code and datasets used to create these examples are available on my GitHub repository.
Demonstration
For this example, I will make use of this “Swedish Committee on Analysis of Risk Premium in Motor Insurance” dataset. This simple dataset is composed of just two columns ( X = number of claims and Y = total payment for all the claims in thousands of Swedish Kronor for geographical zones in Sweden).
As part of this demonstration, we will try to predict the total payment for all the claims by examining the total number of claims distribution.
Set-Up
First of all, we need to create an HTML page where to display our content. The following code snippet provides a basic template, feel free to add any feature you want!
Preprocessing
We can now create another file called script.js (in the same directory of our HTML file) where we can start loading our dataset and perform some basic preprocessing tasks.
In order to load a dataset from a JSON file, we can make use of the following function (getData). In this function we first load our dataset, then we select the columns we are interested in and we give them a user-friendly name. Finally, using a filter function we get rid of all the NaNs (not a number) present in the selected columns.
Successively, we can then create a function to preprocess our dataset (convertToTensor). In this case, we:
- Shuffle the data = randomizing the order of the samples which will be used later for training our regression model. In this way, we can give our model a greater variety of data compared to the original data distribution (that’s because our training data will successively be divided into smaller subsets called batches when being fed in the model).
- Divide the data into features and labels = the features will be our input samples and the labels our true output values (Ground Truth).
- Convert features and labels in tensor form = we take our original arrays and convert them into two-dimensional tensors.
- Normalize the output tensors = rescaling our data to be in a range between 0 and 1. This is done to prevent problems in training models which have extremely big or small values (overflow/underflow). Once trained our model, we can then denormalize our output to obtain our final results.
Defining and Training our model
We can now go on to design a simple Machine Learning model (createModel) and then create a function to train it (trianModel).
In this case, I made use of a callback to call the Tensorflow.js graphing support library tfjs-vis in order to create a real-time graph of how our model loss is changing during training (Figure 1). If you are interested in finding out more in details how callbacks work, I provided a more detailed explanation about them in this article.
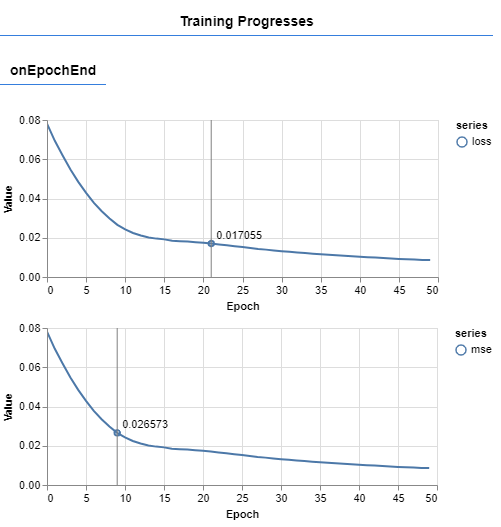
Figure 1: Real-Time model Loss
Testing
Now that our model is trained, we can start making predictions. To do so, I designed the function below (testModel). In this simple example, I decided to use the training data itself to test our model performance.
Additionally, I then denormalized our model predictions and then plot them against the true output so that to check our model performance (Figure 2).
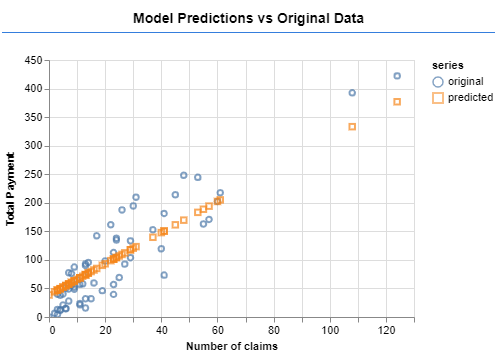
Figure 2: Model Predictions vs Original Data
Running the model
Finally, we now need to create a function to make all our code run (run). In this function, we first perform some data visualization and then call all the functions we defined before (Figure 3).
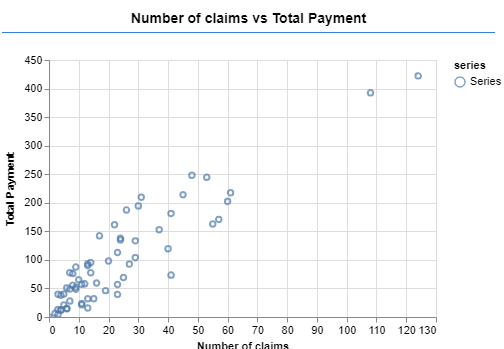
Figure 3: Scatterplot of the original data
You can now test out your model by running it on either your own website or using a local server. In case you never used a local server, one simple solution can be to use Visual Studio Code and install its Live Server extension.
Contacts
If you want to keep updated with my latest articles and projects follow me on Medium and subscribe to my mailing list. These are some of my contacts details:
