Contents
- Paradoxes in Data Science
- Introduction
- Simpson’s Paradox
- Accuracy Paradox
- Learnability-Godel Paradox
- The Law of Unintended Consequences
- Conclusion
- Bibliography
Photo by Shadan Arab on Unsplash
Paradoxes in Data Science
A look into some of the main paradoxes associate with Data Science and it’s statistical foundations
Introduction
Paradoxes are a class of phenomena which arise when, although starting from premises known as true, we derive some sort of logically unreasonable result.
As Machine Learning models create knowledge from data, this makes them susceptible to possible cognitive paradoxes between training and testing.
In this article, I will walk you through some of the main paradoxes associated with Data Science and how they can be identified:
- Simpson’s Paradox
- Accuracy Paradox
- Learnability-Godel Paradox
- The Law of Unintended Consequences
Simpson’s Paradox
One of the most common forms of paradox in Data Science is Simpson’s Paradox.
As an example, let us consider a thought experiment: we carried out a research study in order to find out if doing daily physical exercises can help or not reduce Cholesterol levels (in mg/dL) and we are now starting to examine the obtained results. First, we divide our population sample into two main categories based on the individual’s age (under/over 60 years old) and then we plot their cholesterol levels against the number of hours the subjects exercised per day. By examining the results in the first two plots of Figure 1, we can then infer that exercising for more hours a day can then lead to an overall reduction in our cholesterol levels. This hypothesis can then also be reinforced by examining the overall trend of the best fit line inferred through Linear Regression and the quite strong negative Person Correlation scored in both cases.
At this point, reassured by our derived results, we can then try to repeat this same analysis taking into consideration this time the whole population sample (rightmost plot in Figure 1). In this case, we are faced with a completely contradictory scenario and a positive correlation implying that more exercise can lead to increased cholesterol levels.
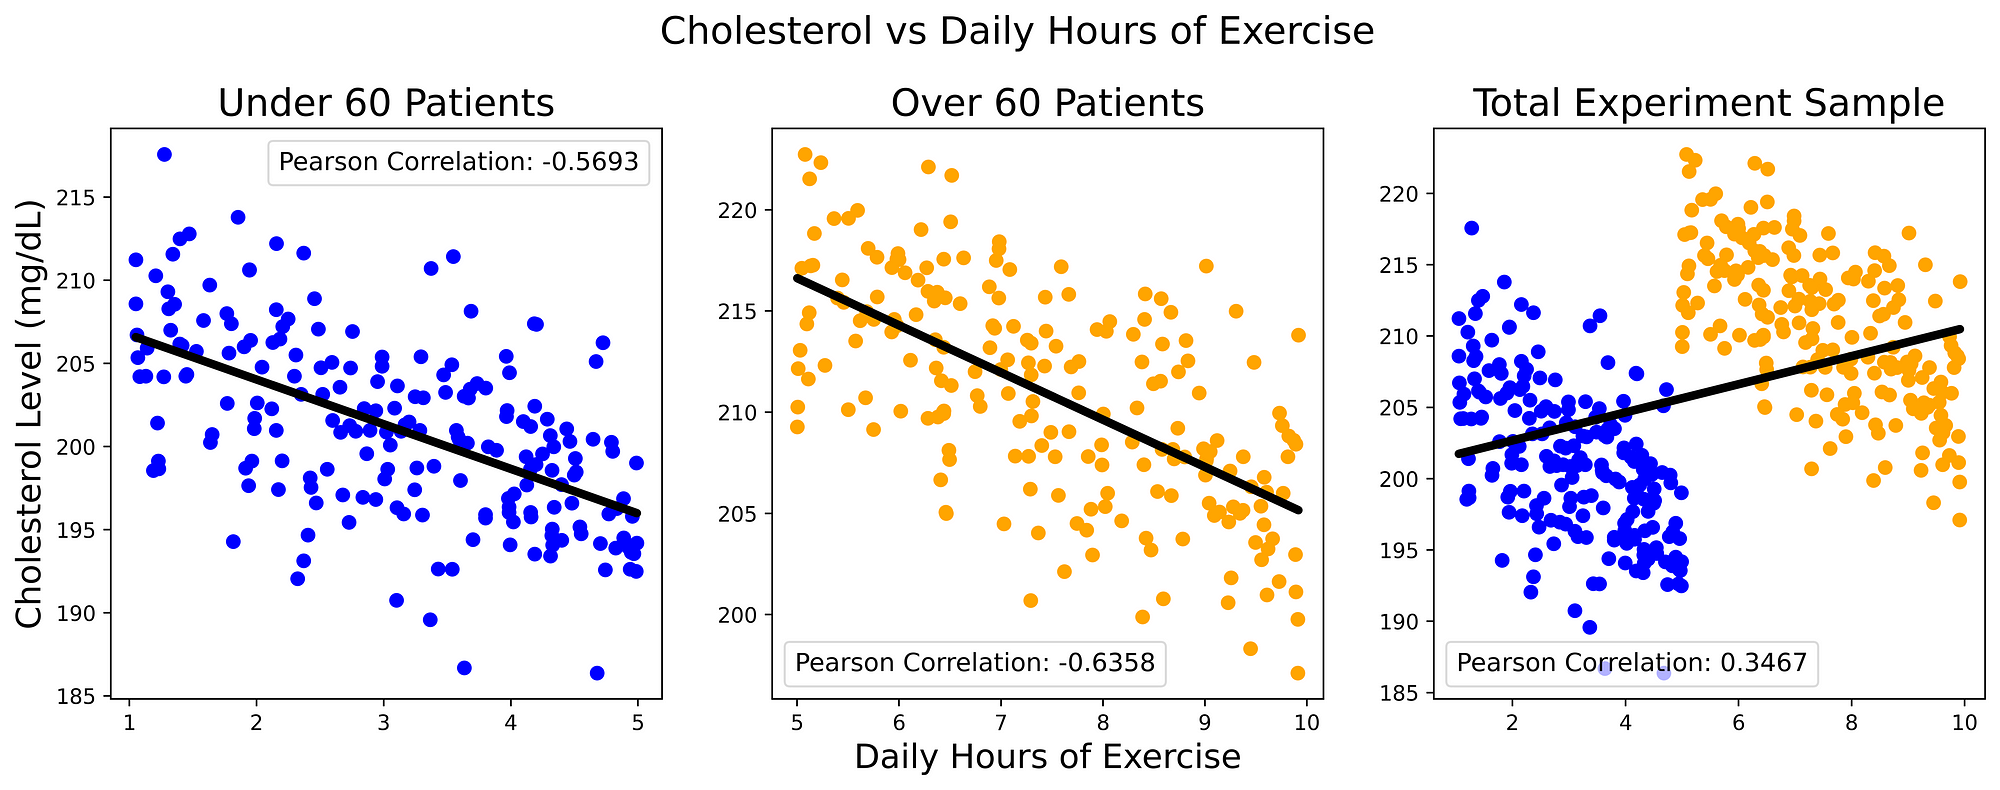
Figure 1: Cholesterol vs Daily Hours of Exercise (Image by Author).
This type of scenario is commonly known as Simpson’s Paradox and takes place every time we have some form of correlation which points in a direction when considered in a sub-group and points instead in the opposite direction if considered as part of the whole group. In order to unveil the reasons behind this type of mechanism, we need to try to go beyond the provided data and think about how our data was generated in the first place to cause this outcome (e.g. what unknown missing variable might be preventing us to see the full picture?).
In this simple scenario, our missing component could be any potentially influential variable such as: individual’s comorbidities, diet and age. We decide then to take a closer look at how cholesterol levels vary with greater age (Figure 2). Repeating the same analysis done in Figure 1, we can then clearly see how cholesterol levels are strongly positively correlated to the individual’s age.
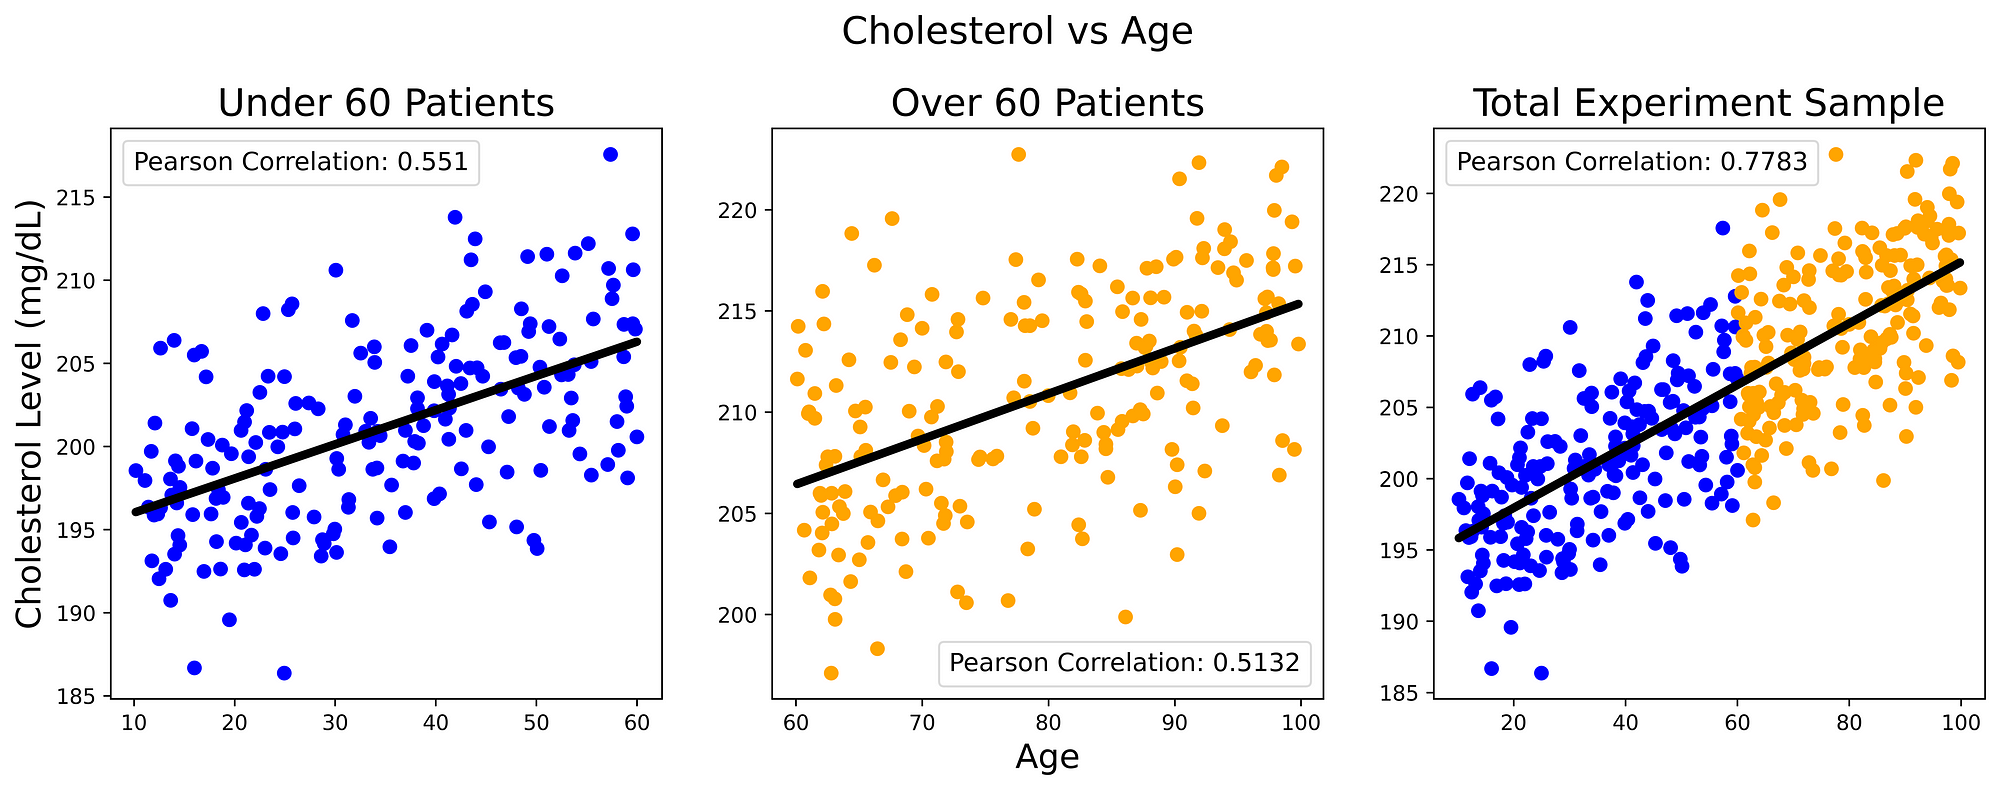
Figure 2: Cholesterol vs Age (Image by Author).
From these results, we can then deduce that cholesterol levels are more likely to increase with ageing and lack of exercise (there is a cause-effect relationship between the three variables). Therefore, in order to try to quantify the benefits of exercising in reducing cholesterol levels and overcome the Simpson Paradox, we should then make sure to run our experiment while having a fixed value for the age of the subjects (controlling the variable).
During the course of the last century, the Simpson Paradox occurred in many statistical studies such as: UC Berkeley gender bias, Kidney stone treatment and Racial disparity in the death penalty [1].
More information about Causality and Causal Reasoning in Machine Learning is available in my previous articles Causal Reasoning in Machine Learning and Answering Causal Questions in AI.
Accuracy Paradox
In our daily life, it is quite common to think that going deeper into studying a subject or learning about a topic will necessarily lead to a greater understanding of the studied phenomena. Although, this isn’t always true, as overspecialization can at times lead us to underestimate the importance of the bigger picture.
This same pattern can happen when creating Machine Learning models that are more complex than necessary. In this case, our model would end up focusing too much on the single data points and not paying attention to the overall trend in the data (overfitting). In this scenario, our model would then be able to perform well on the training data (of which it memorised every little detail), while failing to generalise to new unseen data.
This problem can be summarised in Figure 3. In the figure below, is taken into consideration an example regression problem (how house prices vary with the increase of the number of rooms in a property in Italy).
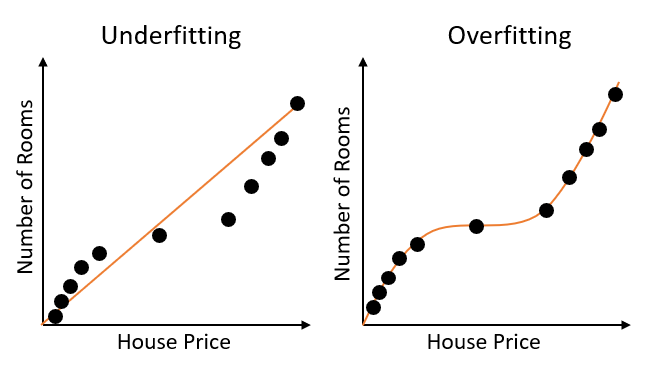
Figure 3: Underfitting vs Overfitting (Image by Author).
Creating a complex model (overfitting) we would be able in this case to get a good estimate of house prices in Italy. Although, our complex model will most likely perform worse than the linear model (underfitting) when trying, for instance, to predict house prices in another country for which it hasn’t been trained on (e.g. Spain).
This leaves us therefore with an Accuracy Paradox. We train our Machine Learning models to improve their accuracy over time, while this might although lead to lower accuracy in production. This problem, can be perfectly summarized by Charles Goodhart quote:
“When a measure becomes a target, it ceases to be a good measure.”
— Charles Goodhart
One of the most common approaches to overcome this issue, is to add regularization during training (a model complexity penalty). In this way, we reduce the weights associated with the less important features and focus our attention on the features which provide us with more information.
In classification problems, the Accuracy Paradox is most likely to appear when working with imbalanced training datasets (some classes appear with much greater frequency than others). In this instance, calculating the precision and recall of the model can become a much more valuable metric.
Learnability-Godel Paradox
Kurt Gödel is one of the most famous mathematicians of the last century. Undisputedly, one of it’s most interesting theories are the two Gödel’s Incompleteness Theorems.
According to these theorems, nowadays Mathematics has some intrinsic limitations which doesn’t allow it to state with certainty if a statement is true or not. The whole field of Data Science is deeply interconnected with mathematical thinking and therefore this leads us to a paradox (Learnability-Godel Paradox).
Depending on if Gödel theory is right or wrong, this would demonstrate to be either possible or not to make extrapolations from a population sample. Machine Learning models heavily relies on using sample datasets for training and if this would be proven to not be enough, then would make it impossible for them to perform correctly any form of extrapolation/prediction. In fact, training a Machine Learning model on the entire population data could be computationally not feasible and in most cases, it would almost be impossible to collect data about an entire population in the first place.
Additional information about this paradox and its applications in Machine Learning can be found in the research publication “Learnability can be undecidable” by Shai Ben-David et. al. [2]
The Law of Unintended Consequences
As systems and models become more complicated, it can turn out to be for us humans more and more difficult to understand how a system might work and make its decisions. This concept is summarised in The Law of Unintended Consequences.
According to this concept, as systems grow in complexity it is more likely that undesired behaviours or “bugs” might involuntarily occur. This frequently turns out to be true when creating big software projects or creating sophisticated Machine Learning models.
With the advent of the Big Data Regime, in recent years, there has been a growing interest in creating techniques in order to make models more explainable and bias-free so that to comply with governmental bodies authorities regulations (e.g. GDPR).
Ultimately, this let us face the last paradox considered in this article. Day by day we thrive to create the best possible model to achieve a result, although this might never be deployed in production if too complex to be understandable (e.g. GDPR Article 5, Right for explanation).
Conclusion
In this article, I introduced some of the main paradoxes related to Data Science. Although, many other common paradoxes could potentially have implications in Data Science and Artificial Intelligence. Some examples are [3]:
- Berkson’s Paradox
- Braess’s Paradox
- Moravec Paradox
- Birthday Paradox
If you have any other paradox which you would like to be added to this list, just let me know leaving a comment!
I hope you enjoyed this article, thank you for reading!
Bibliography
[1] Simpson’s Paradox: How to Prove Opposite Arguments with the Same Data Will Koehrsen, Towards Data Science. Accessed: https://shorturl.at/jkyT9 August 2020.
[2] Learnability can be undecidable, Nature. Shai Ben-David, Pavel Hrubeš, et. al. Accessed: https://www.nature.com/articles/s42256-018-0002-3, September 2020.
[3] Five Paradoxes that Data Scientists Should Know About, MC.AI. Accessed: https://mc.ai/five-paradoxes-that-data-scientists-should-know-about/, September 2020.
Contacts
If you want to keep updated with my latest articles and projects follow me on Medium and subscribe to my mailing list. These are some of my contacts details:
