Contents
Photo by Campaign Creators on Unsplash
Creating Online Data-Driven Presentations
Using Reveal.js and D3.js in order to create interactive online data science presentations
Introduction
Being able to summarise data science projects and show their potential business benefits can play a really important role in securing new customers and make it easier for non-technical audiences to understand some key design concepts.
In this article, I am going to introduce you to two free programming frameworks which can be used in order to create interactive online presentations and data-based storytelling reports.
Reveal.js
Reveal.js is an open-source presentation framework completely built on open web technologies. Using Reveal.js, can then be possible to easily create web-based presentations and to export them in other formats such as PDF.
Some of the most interesting features of Reveal.js are Latex and Markdown support, CSS customization, speaker notes functionalities and syntax highlighting code tools.
Set-up
Reveal.js can be easily installed by cloning the official repository:
git clone https://github.com/hakimel/reveal.js.git
Our presentation can then be developed by modifying the provided index.html file in the reveal.js directory. Using Node.js, we can then easily observe (on a local server at port: http://localhost:8000) in real-time how our updates in the index.html file.
cd reveal.js && npm install
npm start
A simple example of index.html presentation file is available below. As we can see from the code snippet, we first import the Reveal.js library and then black as our theme for the slides (many more themes options are listed on the Reveal.js documentation page!). Each different slide, can then be created by enclosing each of them in a section tag and write all the desired content inside. Nesting different section tags, it can then be possible to create different subsections in the presentation. Finally, in the last script tag, Reveal.js is initialised (passing different optional parameters, functionalities such as Latex and Math formatting can be added).
<html>
  <head>
    <link rel="stylesheet" href="dist/reveal.css">
    <link rel="stylesheet" href="dist/theme/black.css">
  </head>
  <body>
    <div class="reveal">
      <div class="slides">
        <section>First Slide</section>
        <section>Second Slide</section>
        <section>
         <section>Subsection Slide 1</section>
         <section>Subsection Slide 2</section>
        </section>
      </div>
    </div>
    <script src="dist/reveal.js"></script>
    <script>
      Reveal.initialize();
    </script>
  </body>
</html>
Additionally, it is also possible to create the slides in Markdown instead of using HTML and Javascript, by instantiating a slide using the following format and importing the plugin.
<section data-markdown>
  <textarea data-template>
    ## Slide Title
    Example text.
  </textarea>
</section>

<script src="plugin/markdown/markdown.js"></script>
<script>
  Reveal.initialize({
    plugins: [ RevealMarkdown ]
  });
</script>
A fully working example presentation created using Reveal.js, is available at this link (FIgure 1).

D3.js
D3.js is an open-source Javascript library designed to create data-driven visualizations in the web using HTML, CSS and SVG. D3.js can be simply loaded by adding the following line in our working files.
# As new versions of the library might be released, updated versions
# of this link might can be found at this link: https://d3js.org/
<script src="https://d3js.org/d3.v5.min.js"></script>
Using D3.js, elements can be selected by either using their name or CSS selector. Additionally, D3.js provides utilities in order to load datasets and pre-process the data for visualization.
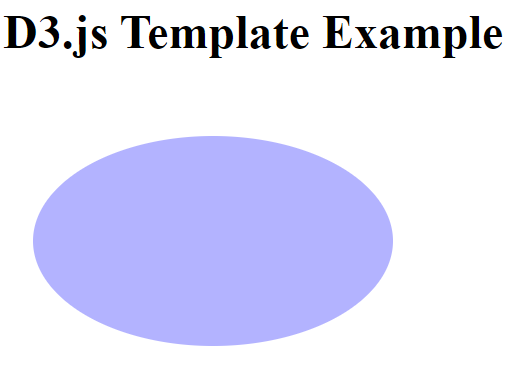
A simple example code to show how to setup D3.js in order to create an ellipse chart, is available below.
<html>

<head>
  <script src="https://d3js.org/d3.v5.min.js"></script>
</head>

<body>
  <h1>D3.js Template Example</h1>
  <script>
    var svg = d3.select("body")
      .append("svg")
      .attr("width", 270)
      .attr("height", 270);

    svg.append("ellipse")
      .attr("cx", 140)
      .attr("cy", 100)
      .attr("rx", 120)
      .attr("ry", 70)
      .attr("opacity", 0.3)
      .attr("fill", "blue")
  </script>
</body>

</html>
D3.js charts can then be used in order to create powerful presentations by integrating them with a scroller architecture. Fortunately, multipurpose scrollers (which can be used for any type of narrative) have been developed in the past few years thanks to authors such as Jim Vallandingham and Cuthbert Chow. A fully working example of a data-driven narrative created by me using a D3.js based scroller is available in the animation below. This can also be tested at the following link.
In case you are interested in learning more about how to create D3.js charts, the D3 Graph Gallery documentation is a great place where to start.
Finally, if you are interested in making your presentations available offline, the FPDF and python-pptx Python libraries can be used in order to automatically generate respectively PDFs and PowerPoints in Python.
I hope you enjoyed this article, thank you for reading!
Contacts
If you want to keep updated with my latest articles and projects follow me on Medium and subscribe to my mailing list. These are some of my contacts details:
